Making Meridian
Post by Kaho Cheung.
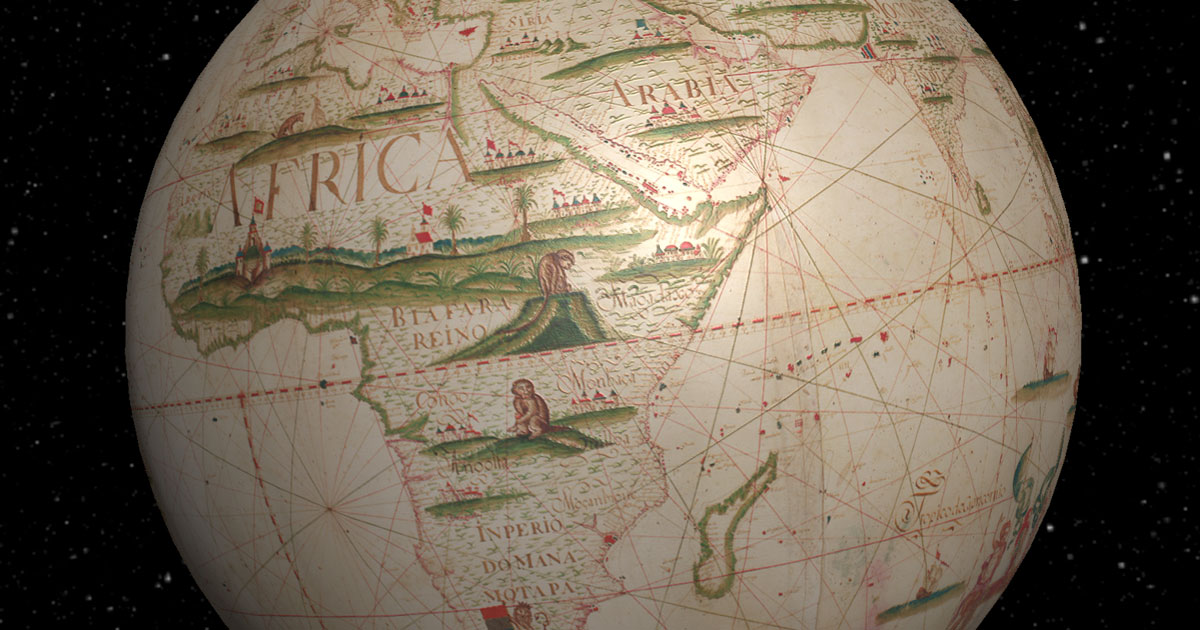
While The Library is famous for its vast collection of books, it also owns a stunning collection of maps from the 17th and 18th centuries. Normally under lock and key in our underground stacks, DX Lab’s new experiment Meridian brings these artefacts to life as interactive 3D globes. Meridian overlays these maps onto a spinning globe, allowing us to imagine how European cartographers really saw the world at the time.
Currently we have two globes to view, with more to be added in the coming months. Each map had to undergo significant image processing before they were ready to be turned into 3D globes.
Miranda’s World Map by Joseph Da Costa e Miranda
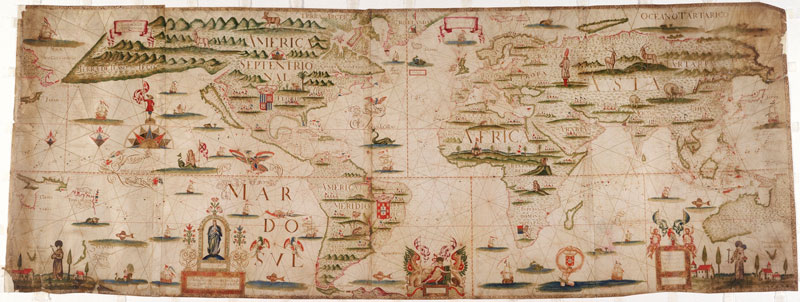
This manuscript map was produced in Lisbon in 1706 by Portuguese cartographer Joseph Da Costa e Miranda, using a cylindrical projection. It was digitised in 2015 at 1200 DPI, using a state-of-the-art high resolution scanner – you can read about the process here.
The end result is an incredibly detailed map of impressive proportions – approximately 50,000 x 20,000 pixels, with a file size of several gigabytes.
One unique aspect of this map is the coastlines of the Australian continent and Eastern Russia are duplicated on either side. This overlapping feature made it a good candidate for use as a 3D model in Meridian. It still required significant Photoshop work to wrap it perfectly – with some ‘artistic license’ required to blend the two sides seamlessly.
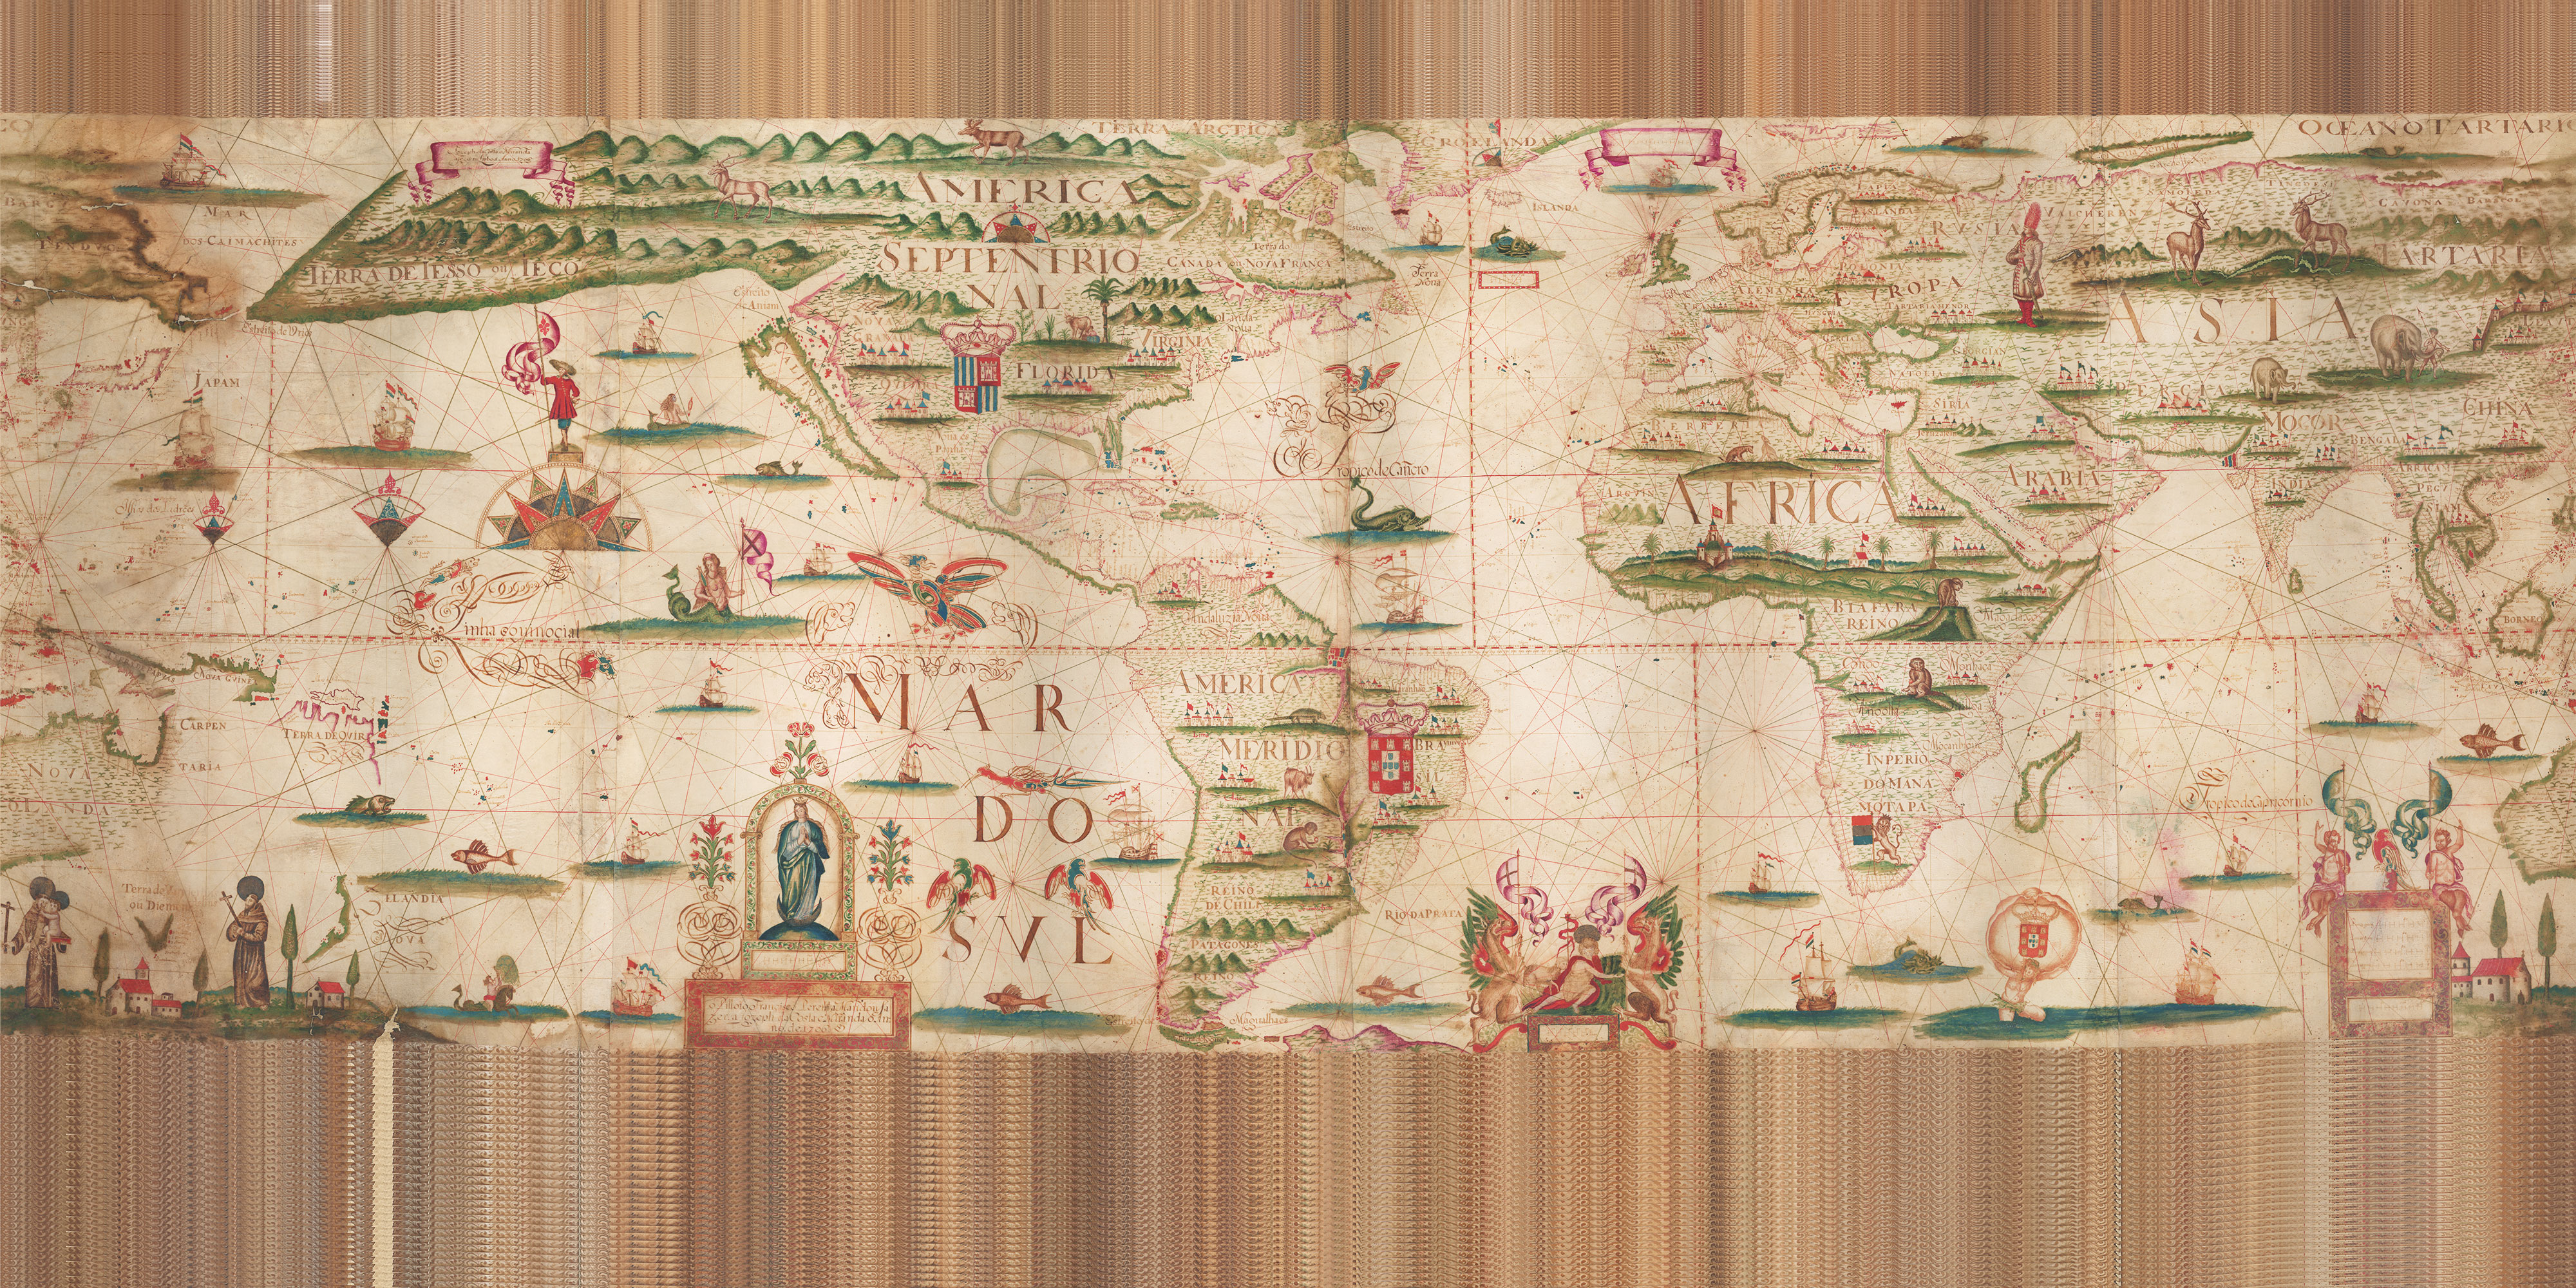
In order to represent a 3D object as a 2D image, a process called projection must be undertaken. In our case, we were doing the opposite, wrapping a 2D image onto a 3D object – in effect unprojecting the image. We roughly used the equirectangular method of projection and worked backwards. Equirectangular images always conform to a 2:1 aspect ratio, with minimal distortion around the equator and increasing distortion as the image gets closer to the poles.
We didn’t have access to map projection software, so I manually distorted the image by eye, gradually vertically squashing the image more and more as it got closer to the top and bottom.
The last step involved moving the equator up to the middle and to reframe the image with a 2:1 aspect ratio. To solve both these problems, we ended up filling the top and bottom of the map with repeated cloned versions of the map border to raise the equator line. Not a perfect solution, but other options were going to be too time consuming.
Here is the final version below:
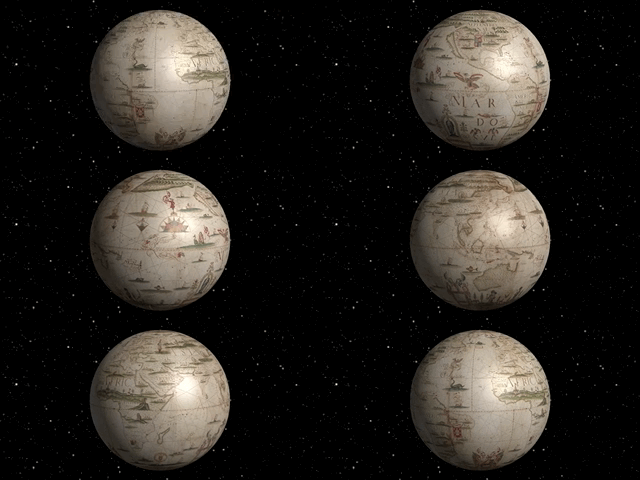
And the result in 3D:
Luckily, I didn’t have to repeat the whole process for the next map.
Coronelli Terrestrial Globe by Vincenzo Maria Coronelli
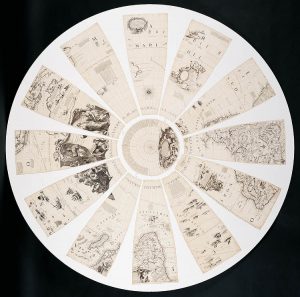
This set of 24 gores and 2 polar calottes were printed from copper engravings in 1693. Italian cartographer Vincenzo Maria Coronelli began the engravings for the 110 cm globes in 1688 following the success of the two large 4 metre globes produced for King Louis XIV in the early 1680s.
Unlike Miranda’s World Map, we were able to source a version of Coronelli’s gores that were ready for mapping to 3D from cartographer David Rumsey’s website. David has kindly given us permission to use his image, as well as some info on how he created it. Here was his process:
I made the unprojected image using Global Mapper. The gores were georeferenced first using a conic projection and the two polar caps were georeferenced using polar stereographic if memory serves. Then both were reprojected in geographic (unprojected) and joined.
The unprojected image wrapped perfectly around the 3D globe on first go (image below).
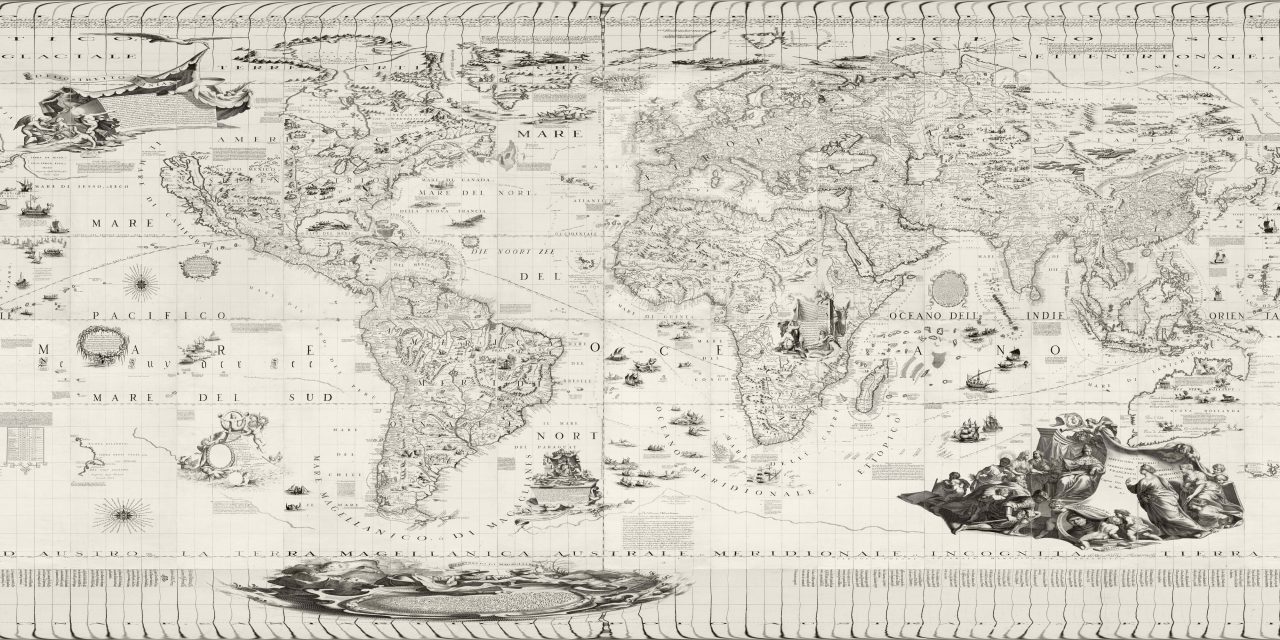
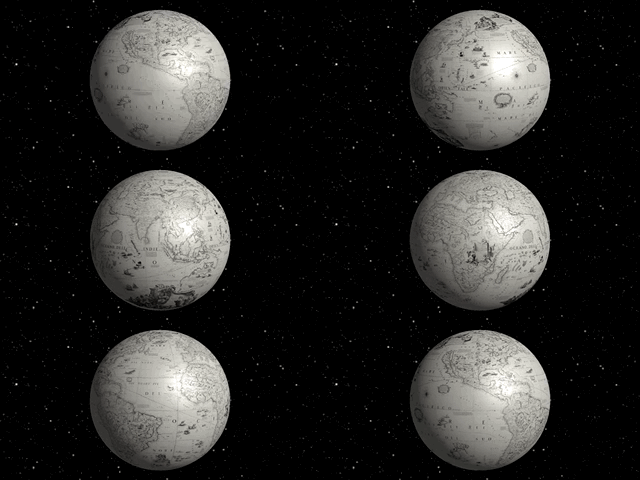
The map wrapped in 3D below:
Code
Meridian uses some well known Javascript frameworks to build the 3D model and user interface:
The bulk of the project follows this Three.js globe tutorial by Bjørn Sandvik from mastermaps.com. He details all the steps in building an interactive 3D version of Earth. With a few tweaks, we were able to use our own maps instead.
One helpful hint he described was overlaying a ‘bump map’ to give the globe some texture. This involved converting the source map to greyscale, inverting it and adjusting the contrast. The image below shows the bump map used for Coronelli’s Terrestrial globe.
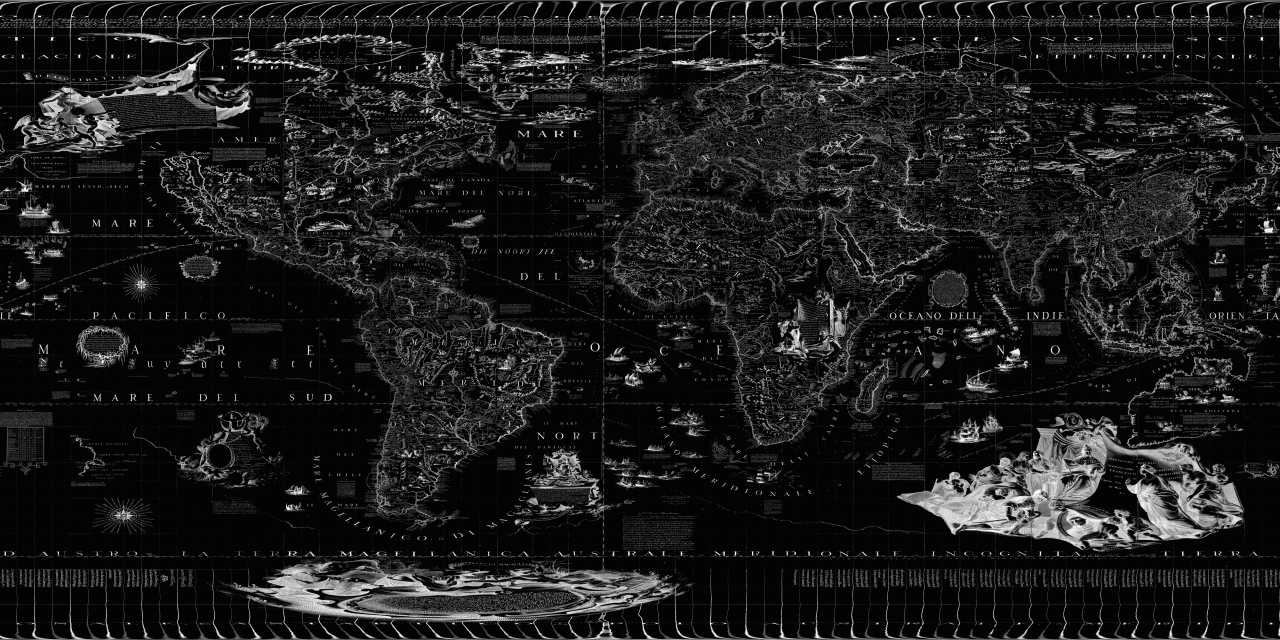
The lighter parts will seem higher, so it catches the light more and subtly adds to the globe’s realism.
The user interface components of Meridian are built with a relatively new library called Vue.js. While React and Angular are popular alternatives, we thought it was worth experimenting with Vue.js due to its growing popularity. Vue.js can also be added incrementally to a web application, which made it easier than React/Angular to integrate with Three.js.
We have open sourced the source code for Meridian. Feel free to clone and experiment in your own projects.
Future
We will be adding more globes to Meridian over the next year, in particular, Coronelli’s other masterpiece, the Celestial version of his globe. We’ll also continue working on the globe viewer interface and work out a way to view higher resolution versions of the globes.
Credits
Many thanks goes to Bjørn Sandvik from mastermaps.com. His tutorial provided the basis for this project.
In addition, David Rumsey has kindly given us permission to use his unprojected image of the Coronelli Terrestrial Map.
Maggie Patton (Manager of Research and Discovery) for her ideas and map descriptions.
Luke Dearnley for Three.js tweaks.


Comments
Great stuff Kaho!