Real time search
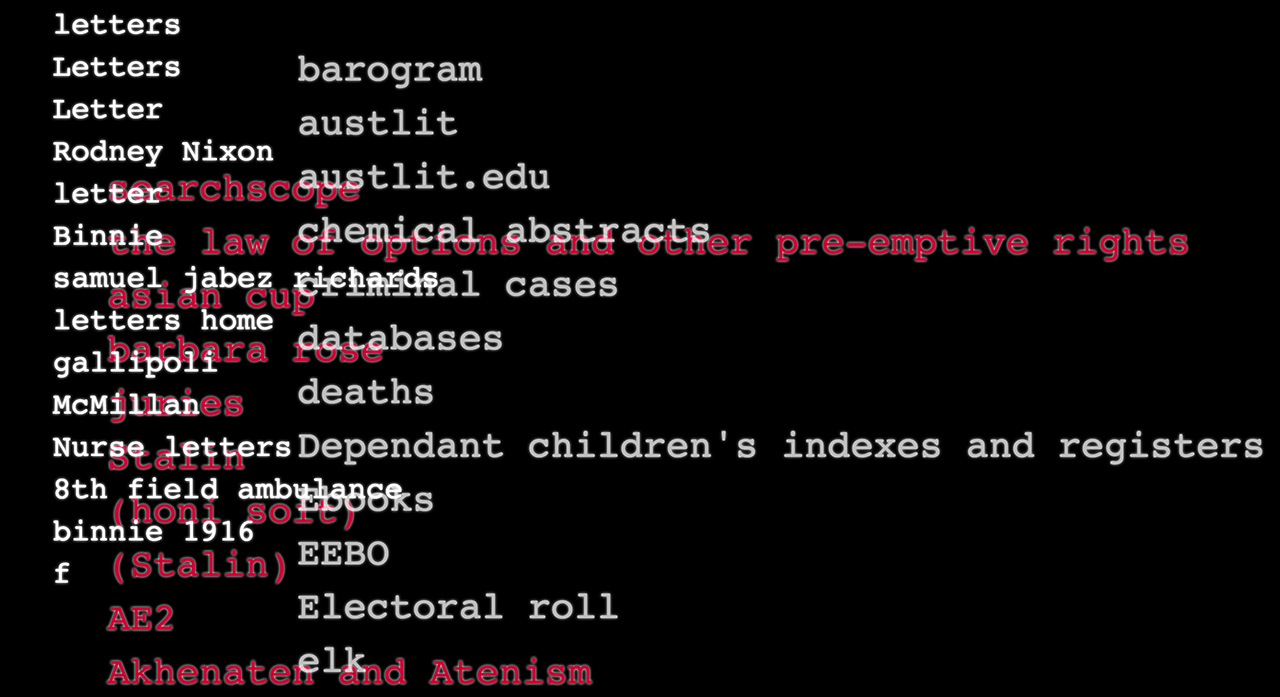
We are interested in what our visitors are searching for whilst using our collection whether they are in our Reading rooms or online. How can we turn daily search into a beautiful data visualisation that we could potentially design and project onsite? We are interested in the convergence of mixing the online experiences and the physical onsite experience. This is a research project. The screencasts below are the first cut of how the data is coming through with slight design variations
The search terms data was extracted from Google Analytics for each of the State Library’s online collection archives. These are actual queries as typed by the various visitors to our collections.
The individual archives are indicated with different text size and colour treatments. While the Library has many archives, this project was initiated as a proof of concept and represents only three. Catalogue searches are in red, World War I diaries in white, and eResources in grey.
In Google Analytics we created customised reports for each archive and ran the export to CSV file format. We are currently developing scripts to automate this process. At this stage the of the project, the data collection was very manual and labour intensive. Often, more than 5000 searches had been executed which would mean exporting more than one set of data before combining and de-duping the results.
Using a basic batch process, we converted the CSV to a simple XML which was then rendered in a browser using XSLT. We used jQuery to animate the terms, as if they were being newly typed in.
The difficulty came in managing a pool of data large enough to make the visualisation interesting, and informative. Raw data comes riddled with anomalies, inconsistencies, and errors, that simple machine processes can’t handle. For example, sometimes a user had begun wrapping their query in quotes without closing them. While this may have caused the search to fail, Google Analytics correctly captured this as valid user input. XML is very sensitive about un-closed quotation marks, and unless they were ‘escaped’ in the code, our data would not render at all. Little by little the simple batch file became more and more complicated as additions were made to ‘clean’ the data before it could be used.
The result was surprisingly mesmerising. Suddenly we were able to see actual queries that real visitors to the Library are making. We can see what is topical on any given day, or how persistent the user is when having difficulty retrieving the right information. The visualisation made data entertaining as well as insightful.


Comments
Dynamically generated content based on real time user engagement is such a great practice. Would love to see more of this.
Ben John Grady
Private I Marketing